General
In this chapter, the basic functionality of the PMP Tooling is explained.
Views
Start the PMP Tooling software from windows start menu or the desktop. By default, a welcome page is displayed (see PMP Tooling welcome page).
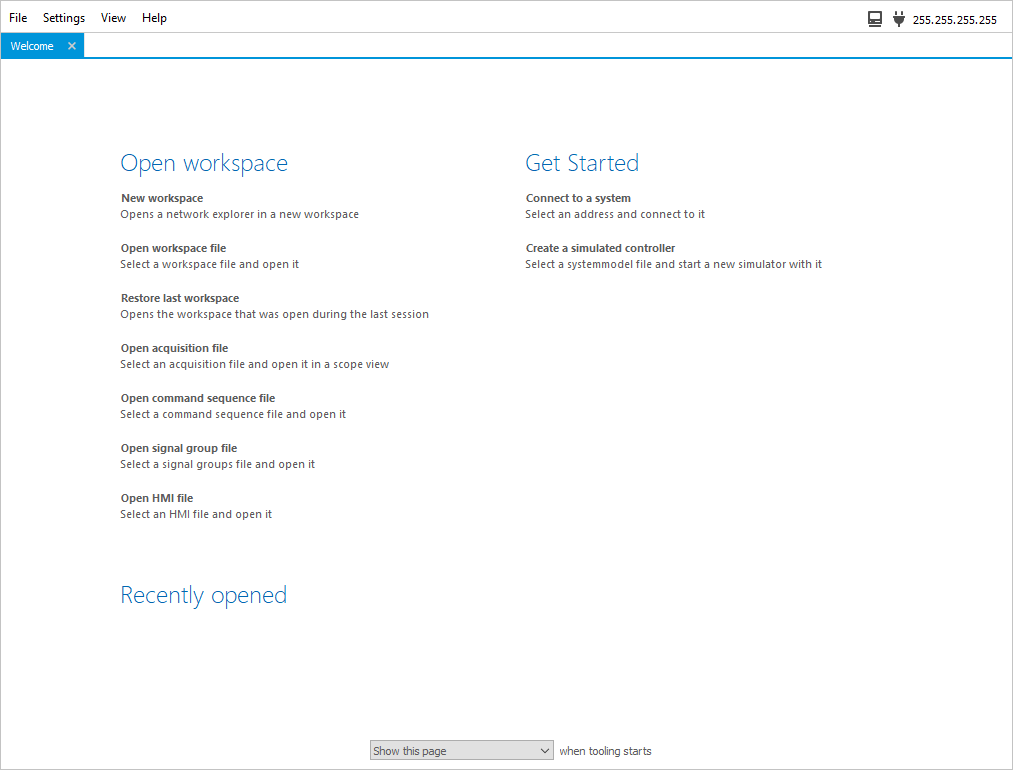
PMP Tooling welcome page
From the menu, other views can be opened as well. Views can be rearranged by double-clicking on the name of the view and dragging it to the desired position. The following views are available in the PMP Tooling:
|
Network Explorer |
Hierarchical view of the discovered controller and their contents |
|
Log |
Lists time-stamped log messages |
|
Events |
Logs triggered event and event responses |
|
Signals |
Monitor signals and alter signal values |
|
Signal Groups |
Create signal groups to drop in another view |
|
Scope |
Plot signal values |
|
Command Sequence |
Create and run a command sequence |
|
State Machine |
Graphical representation of a state machine |
|
HMI |
Create a custom view with predefined GUI components |
The functionality of these views is explained in the following sections.
Discover system
By default, the PMP Tooling is connected to localhost.
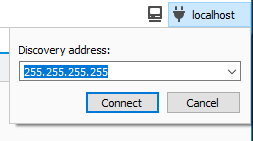
To change the discovery address click on the ![]() icon on the top right of the menu bar (Ctrl-D).
A popup menu (see Discover system using IP or name) will show where the desired Discovery Address can be filled in.
Click on Connect to discover this address.
Use the address “255.255.255.255” to discover all controllers on the current network.
To rediscover the same address, go to or press Ctrl-R.
icon on the top right of the menu bar (Ctrl-D).
A popup menu (see Discover system using IP or name) will show where the desired Discovery Address can be filled in.
Click on Connect to discover this address.
Use the address “255.255.255.255” to discover all controllers on the current network.
To rediscover the same address, go to or press Ctrl-R.
Discover system using IP or name
Alternately, one could discover via the ![]() icon in the Network explorer, described in Sorting and filtering.
icon in the Network explorer, described in Sorting and filtering.
Workspace
A workspace essentially comprises all views opened in the PMP Tooling combined with the signals etc. opened in the views. The controller itself is not part of the workspace. Any name changes, signal writes, etc. are not part of the workspace. A workspace can be saved by clicking (Ctrl-S). To open a previously saved workspace click (Ctrl-O).
See also
- It is possible to start the PMP Tooling with a custom workspace by adding
workspace.xmlto the executable pmptooling.exe. pmptooling.exe workspace.xml
Alternatively, one could also set a custom Default workspace, see Preferences.
Remap controller
It is possible to save the discovered controller workspace with a reference to a different controller (controllers could differ on name, IP address, SN, and PN). Views that contain objects from these undiscovered controllers will not fully function. The controllers from these objects can be remapped using the Remap dialog. This dialog is opened when opening a workspace or by clicking . An example of a remap dialog is shown in Remap controller dialog. The controller configuration is shown at the left tree view. The left column shows the source controller, which could be remapped by selecting a target controller at the right column. The right tree view shows the result of the remap. Items that successfully remapped are shown in green and items that are not found are shown in red.
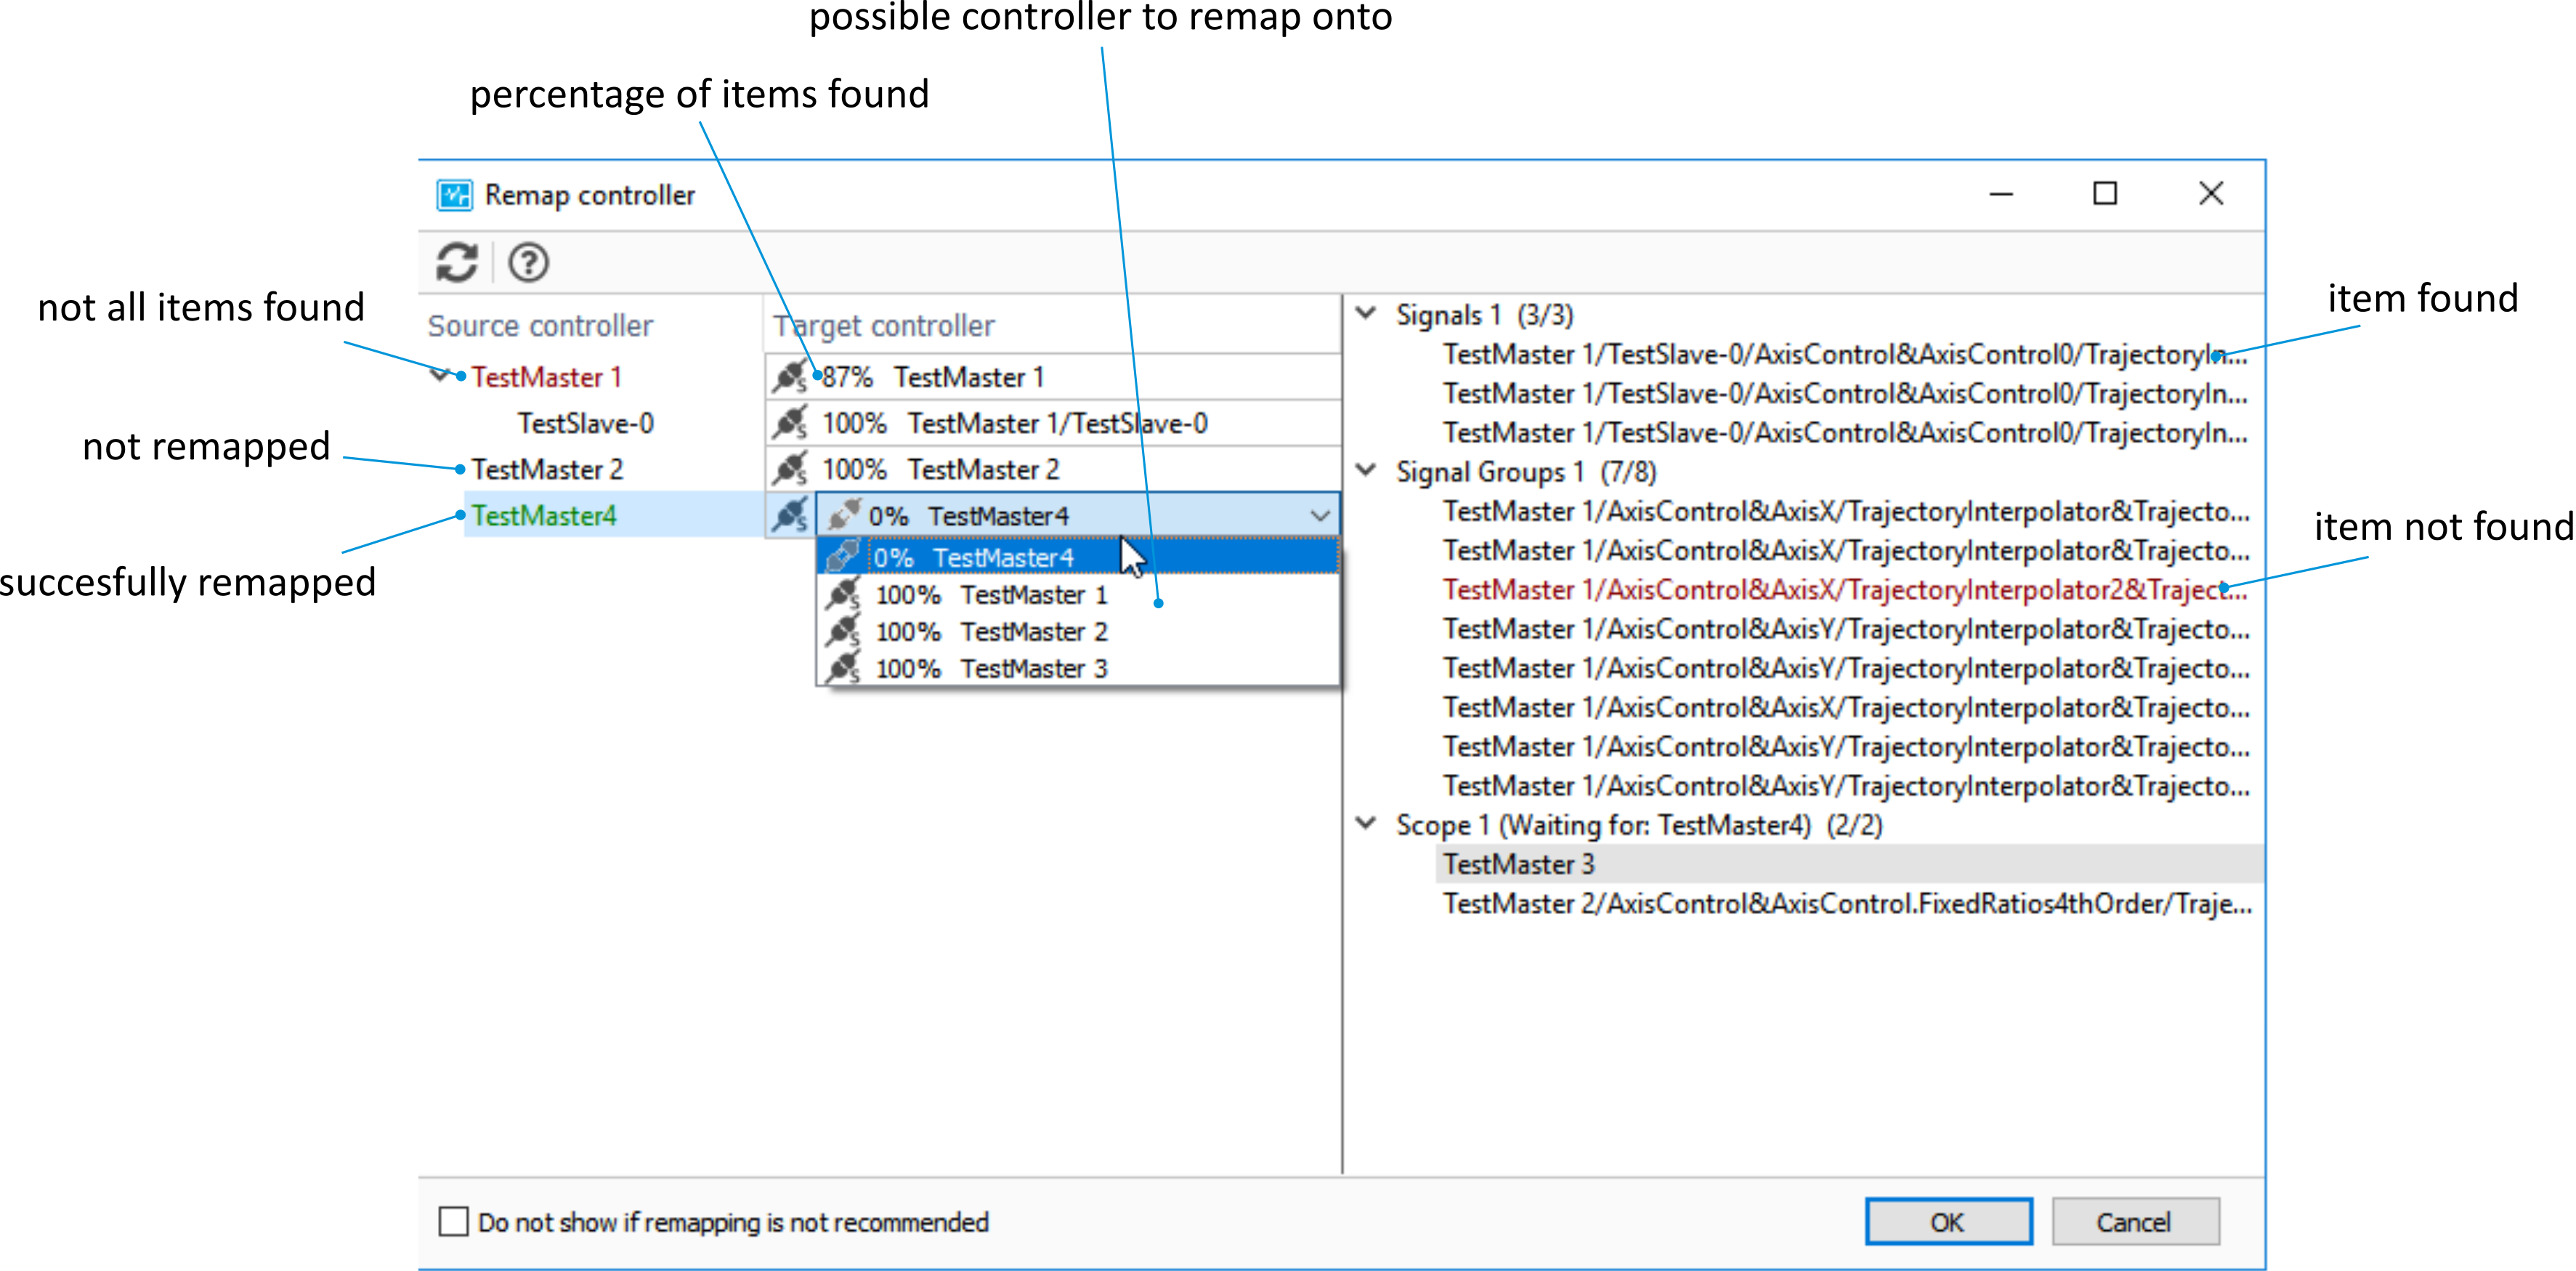
Remap controller dialog
A detailed overview of the target and source controller could be obtained by right-clicking a controller and clicking on . In this dialog (see Remap controller properties dialog). the properties of the Source controller and Target controller can be reviewed. Controller properties that differ are shown in bold.
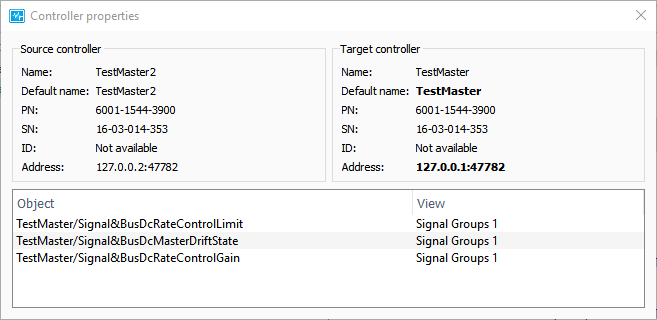
Remap controller properties dialog
Updatables
The updatable transactions, are shown in the updatable transaction dialog (see Updatable transactions dialog). This dialog is automatically opened when loading or saving a file of an updatable item. Alternatively, the dialog can also be opened via . The dialog keeps a history of the updatable transaction performed in the PMP Tooling session, which can be cleared by clicking on the trash bin icon.
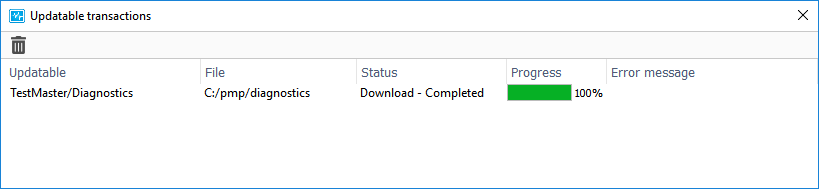
Updatable transactions dialog
Preferences
The PMP Tooling preferences contain both general PMP Tooling settings as default settings for new views. To open the preferences, go to (Ctrl-,).
The first tab contains the General preferences (see Preferences - General). The General settings consist of settings, which are not directly related to a specific view. The other tabs contain default settings for a specific view type. A brief explanation of a specific setting is provided when hovering the mouse over the setting, which opens a tooltip.
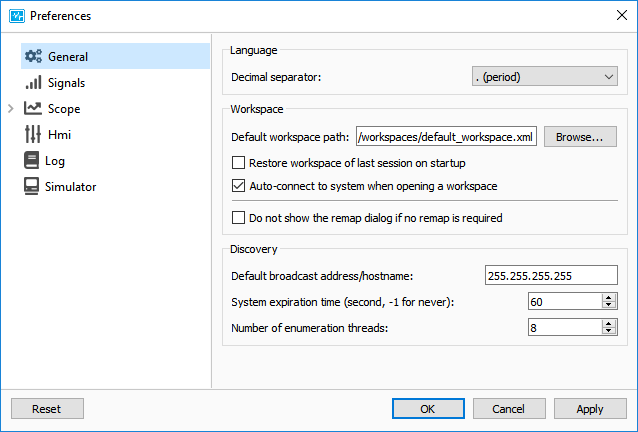
Preferences - General
Create simulated system wizard
The Create simulated system wizard can be opened in one of three ways: (1) from the welcome page, (2) by clicking the ![]() icon next to the discovery address or (3) by selecting in the application toolbar.
icon next to the discovery address or (3) by selecting in the application toolbar.
The wizard allows for the creation of a system description with top-controllers, buses and sub-controllers based on available Controller description XML files. In addition, the wizard can be used to modify the simulator settings for the system description.
At the end of the wizard setup, the created system can be exported to a System description XML file. Alternatively, users can choose to start a simulator using the newly configured system description directly from the wizard.
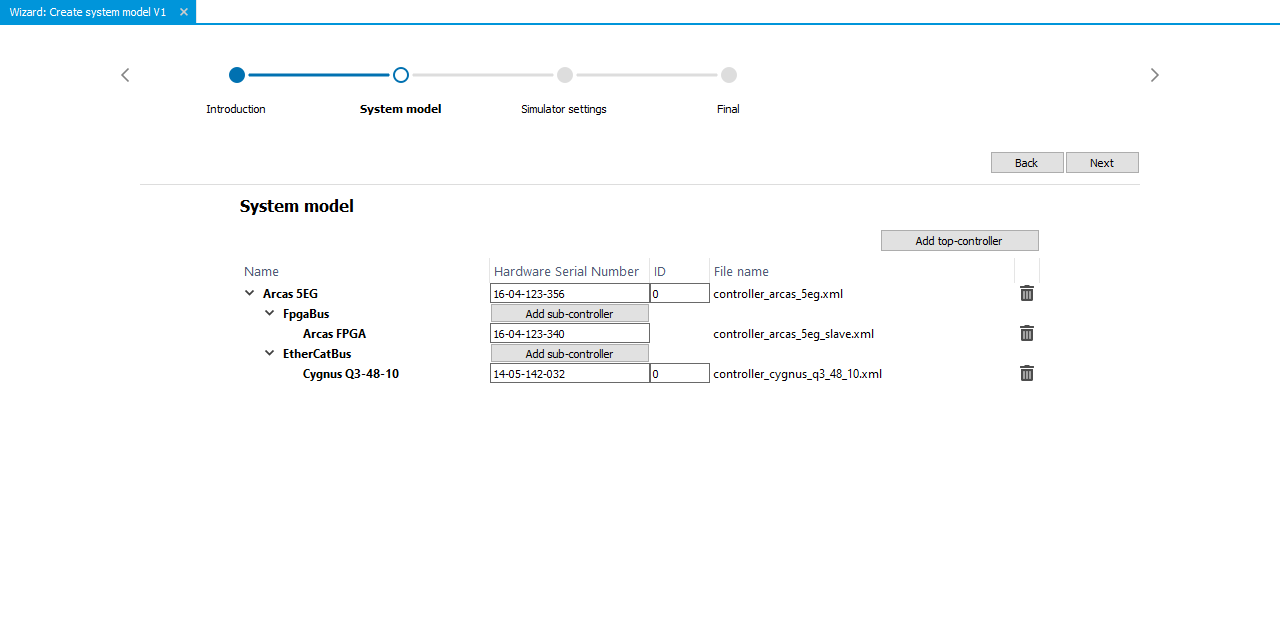
Create simulated system wizard
See also
- Create a simulator
Quick-start guide to create a simulator using the PMP Tooling.